Publications
Published in Undergoing Review, 2025
We developed KnowEEG, a novel machine learning pipeline for EEG classification that addresses the ‘black box’ problem of modern deep learning models. By extracting a comprehensive set of understandable features from EEG signals and using a custom tree-based model (fusion forest), KnowEEG achieves state-of-the-art performance while providing full model explainability. This work demonstrates that our approach can not only match the performance of complex deep learning architectures across five different EEG tasks but also discover correct, verifiable neuroscientific knowledge from the data.
Download here
Published in IEEE International Workshop on Machine Learning for Signal Processing, 2024
We evaluate the effectiveness of combining brain connectivity metrics with signal statistics for early stage Parkinson’s Disease (PD) classification using electroencephalogram data (EEG). The data is from 5 arousal states - wakeful and four sleep stages (N1, N2, N3 and REM). Our pipeline uses an Ada Boost model for classification on a challenging early stage PD classification task with with only 30 participants (11 PD , 19 Healthy Control). Evaluating 9 brain connectivity metrics we find the best connectivity metric to be different for each arousal state with Phase Lag Index achieving the highest individual classification accuracy of 86% on N1 data. Further to this our pipeline using regional signal statistics achieves an accuracy of 78%, using brain connectivity only achieves an accuracy of 86% whereas combining the two achieves a best accuracy of 91%. This best performance is achieved on N1 data using Phase Lag Index (PLI) combined with statistics derived from the frequency characteristics of the EEG signal. This model also achieves a recall of 80% and precision of 96%. Furthermore we find that on data from each arousal state, combining PLI with regional signal statistics improves classification accuracy versus using signal statistics or brain connectivity alone. Thus we conclude that combining brain connectivity statistics with regional EEG statistics is optimal for classifier performance on early stage Parkinson’s. Additionally, we find outperformance of N1 EEG for classification of Parkinson’s and expect this could be due to disrupted N1 sleep in PD. This should be explored in future work.
Published in AAAI Health Intelligence Workshop (pending publication in Computation Intelligence Springer Book Series), 2024
Detecting Parkinson’s Disease in its early stages using EEG data presents a significant challenge. This paper introduces a novel approach, representing EEG data as a 15-variate series of bandpower and peak frequency values/coefficients. The hypothesis is that this representation captures essential information from the noisy EEG signal, improving disease detection. Statistical features extracted from this representation are utilised as input for interpretable machine learning models, specifically Decision Tree and AdaBoost classifiers. Our classification pipeline is deployed within our proposed framework which enables high-importance data types and brain regions for classification to be identified. Interestingly, our analysis reveals that while there is no significant regional importance, the N1 sleep data type exhibits statistically significant predictive power (p < 0.01) for early-stage Parkinson’s Disease classification. AdaBoost classifiers trained on the N1 data type consistently outperform baseline models, achieving over 80% accuracy and recall. Our classification pipeline statistically significantly outperforms baseline models indicating that the model has acquired useful information. Paired with the interpretability (ability to view feature importance’s) of our pipeline this enables us to generate meaningful insights into the classification of early stage Parkinson’s with our N1 models. In Future, these models could be deployed in the real world - the results presented in this paper indicate that more than 3 in 4 early-stage Parkinson’s cases would be captured with our pipeline.
Download here
Projects
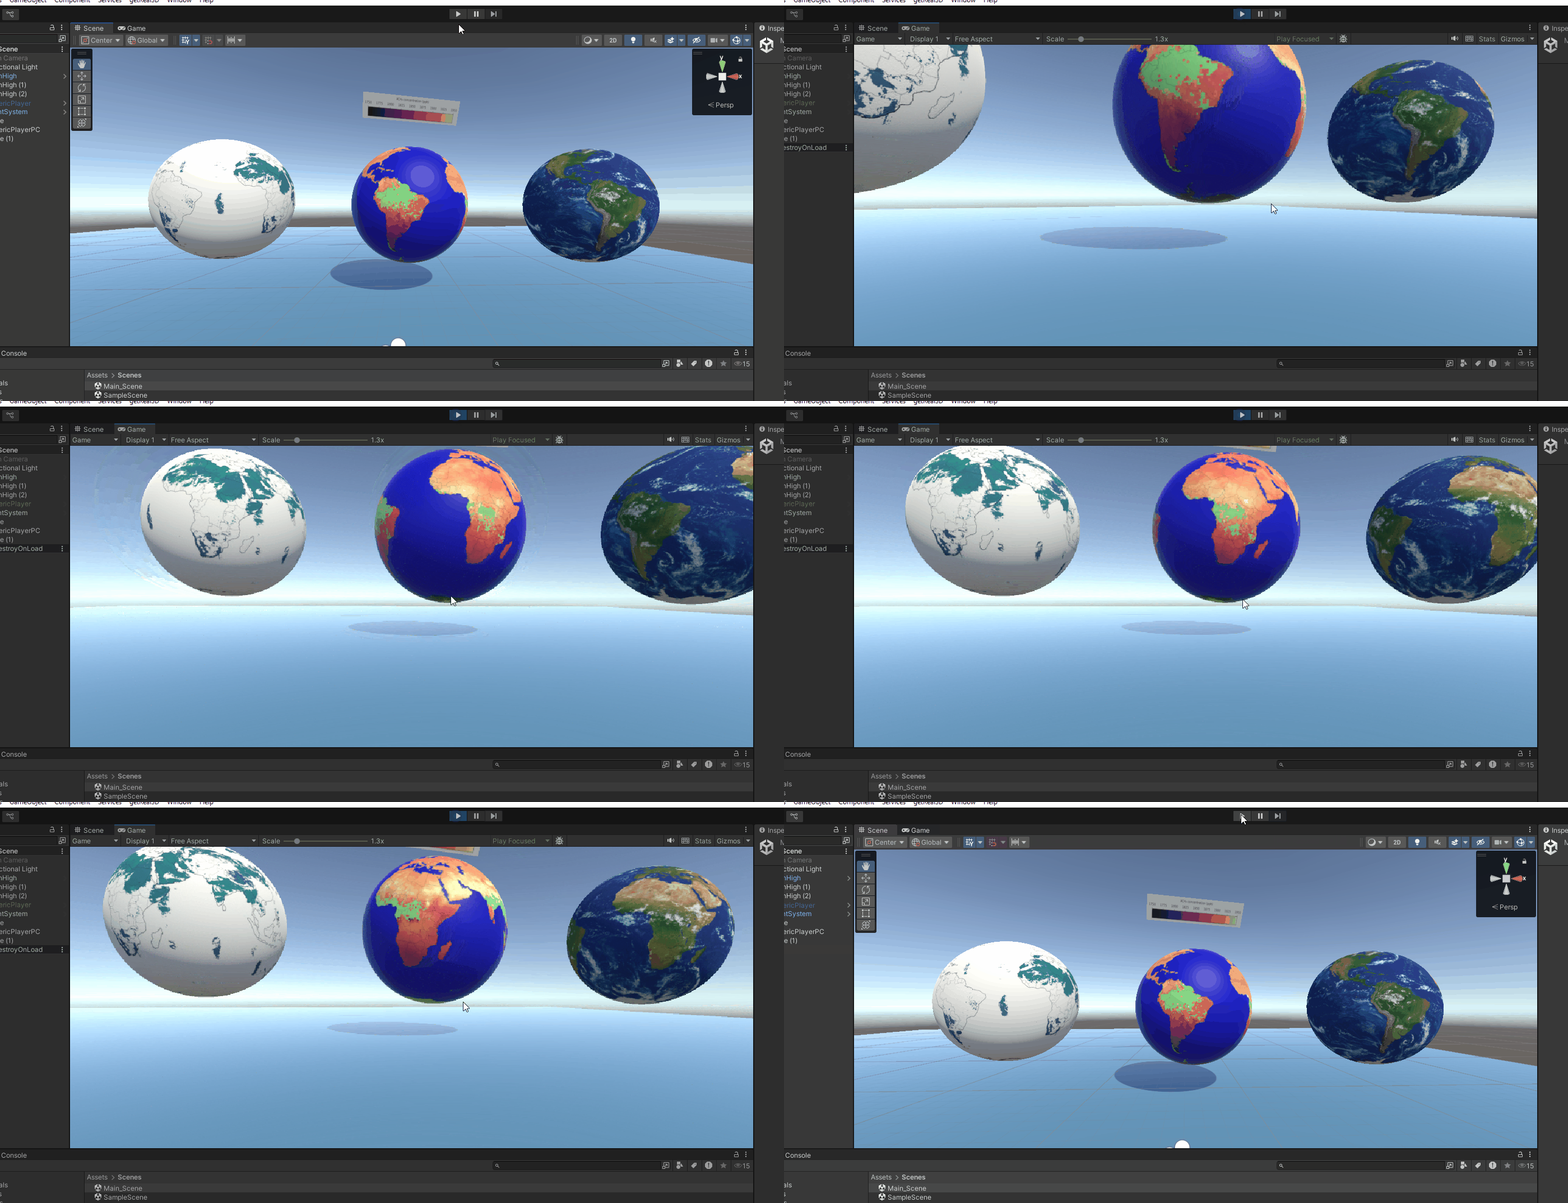
Interactive Earth Climate Visualisation in Unity
This project uses Python to process and visualize global atmospheric data from the TROPOMI satellite, specifically focusing on methane concentrations. The code cleans the data, handles land/sea masking, and generates high-resolution global map plots. These 2D map outputs are designed to be imported into Unity as materials for creating interactive 3D visualizations of climate trends.
The github repo for plotting the atmospheric data can be accessed here and the Unity github repo here.

We won a prize of $250 for this work at the 2023 AAAI Health Intelligence Hackathon. Our work used a convolutional neural network to predict biological age from participant MRI images. We looked to improve existing age prediction models by ensuring features known to be unrelated to age were not being attended to by the model.
The SPHERE challenge presents an activity recognition task based on multimodal data collected from Smart Home sensors. While aiming to advance the safety of vulnerable people, the intrusive nature of the SPHERE technology renders transparency a particularly important feature of any SPHERE solution. Accordingly, current researchers present an interactive visualization dashboard that offers clear insights into the collected data, while giving healthcare professionals an opportunity to evaluate an algorithm’s predictions and assess sensor activity at the proximate time of an identified incident. Two phases of research are presented: 1) data modelling, 2) dashboard development. After curating multiple datasets that attempted to address key pre-processing challenges (e.g. pertaining to missing data points and an imbalanced class distribution), the data modelling phase trained and tested a series of machine learning models. Using Brier score as the selected evaluation metric, a multilayer perceptron, trained on a subset of selected features, was identified as the top performer with a score of .205. The dashboard development phase then visualised a sample recording sequence, displaying multiple data features for each second of the sequence. Visualizations included: bounding box positions, accelerometer data, the patient’s precise location within the smart home, and the predicted label distribution associated with the given timestep. The resulting dashboard offered insightful information, however there are potential improvements such as integrating a recent history of actions to give a clearer outline of data trends. Its efficacy can be further enhanced by optimising model performance, for example through a more sophisticated weighted re-sampling procedure and a greater focus on recall to emphasise minority classes.

